
Dashboards
Interactive companions to LSI research.
Each dashboard is designed to help leaders move from a national statistic to a local decision.
Mapping opportunities to preserve affordable housing.
A property-level view of the Low-Income Housing Tax Credit portfolio, designed to locate preservation risk before it becomes a permanent loss of affordable units.
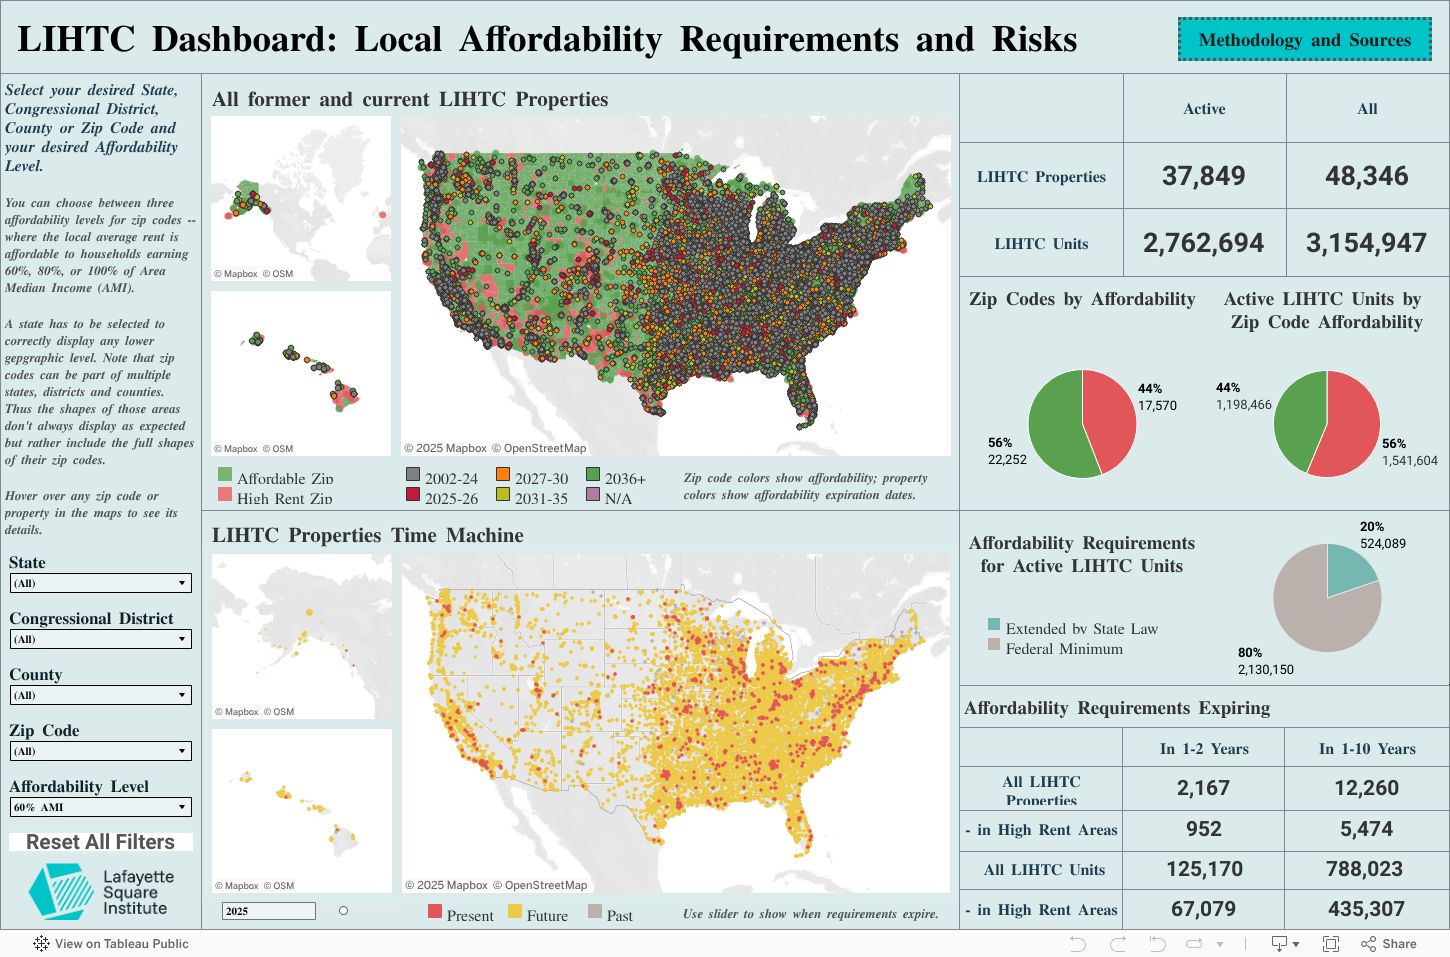
The Low-Income Housing Tax Credit is the largest source of affordable housing finance in the United States. Since 1986, LIHTC has financed more than 48,000 properties and 3.15 million rent-restricted units, concentrated in the markets where working-class renters actually live.1 In Dallas, the median LIHTC rent sits at roughly $1,490, hundreds of dollars below the market-rate median for comparable units. Preserving that kind of unit is not a subsidy debate. It is a supply question.
The problem is that LIHTC affordability is not permanent. Units exit the program when their 15-year compliance period and 15-year extended-use period conclude, at which point the property can convert to market rate unless a state agency, a preservation buyer, or a new allocation of credits intervenes. Roughly 125,000 units are scheduled to reach that threshold by 2026, and nearly 800,000 within the next decade. About 435,000 of those units sit in high-rent ZIP codes, where conversion pressure is greatest and the loss of a single property can displace dozens of working-class households.2
This dashboard brings the National Housing Preservation Database together with Census geography to show where those preservation decisions are coming due, which properties still carry state-level extended affordability restrictions, and how rents compare to Area Median Income at the tract level. The goal is to move preservation from a reactive posture, where HFAs and mission investors learn of a looming conversion after the fact, to a forward-looking view of the pipeline two, five, and ten years out.
The policy opportunity sits alongside the data. The Novogradac modeling of a 4% and 9% LIHTC expansion, included in the Senate-passed reconciliation framework, projects capacity for roughly one million additional affordable units against a national shortage Harvard Joint Center for Housing Studies puts at 8.3 million.3 An SBIC-style structure that channels institutional private credit into LIHTC preservation, modeled on a program Congress has run for small-business investment since 1958, would translate a larger credit allocation into the patient capital preservation actually requires.
Sources
- HUD Office of Policy Development and Research, Low-Income Housing Tax Credit Database (property-level file through placed-in-service year 2022).
- National Housing Preservation Database, Subsidized Housing Information Tool, Public and Affordable Housing Research Corporation and National Low Income Housing Coalition.
- Novogradac & Company, Estimated Unit Impact of LIHTC Provisions in the Senate Reconciliation Framework (2025); Harvard Joint Center for Housing Studies, America’s Rental Housing 2024.
A national profile of privately-held ESOPs.
Where employee-owned firms cluster, what they make, and where the retirement-wave succession opportunity is largest.
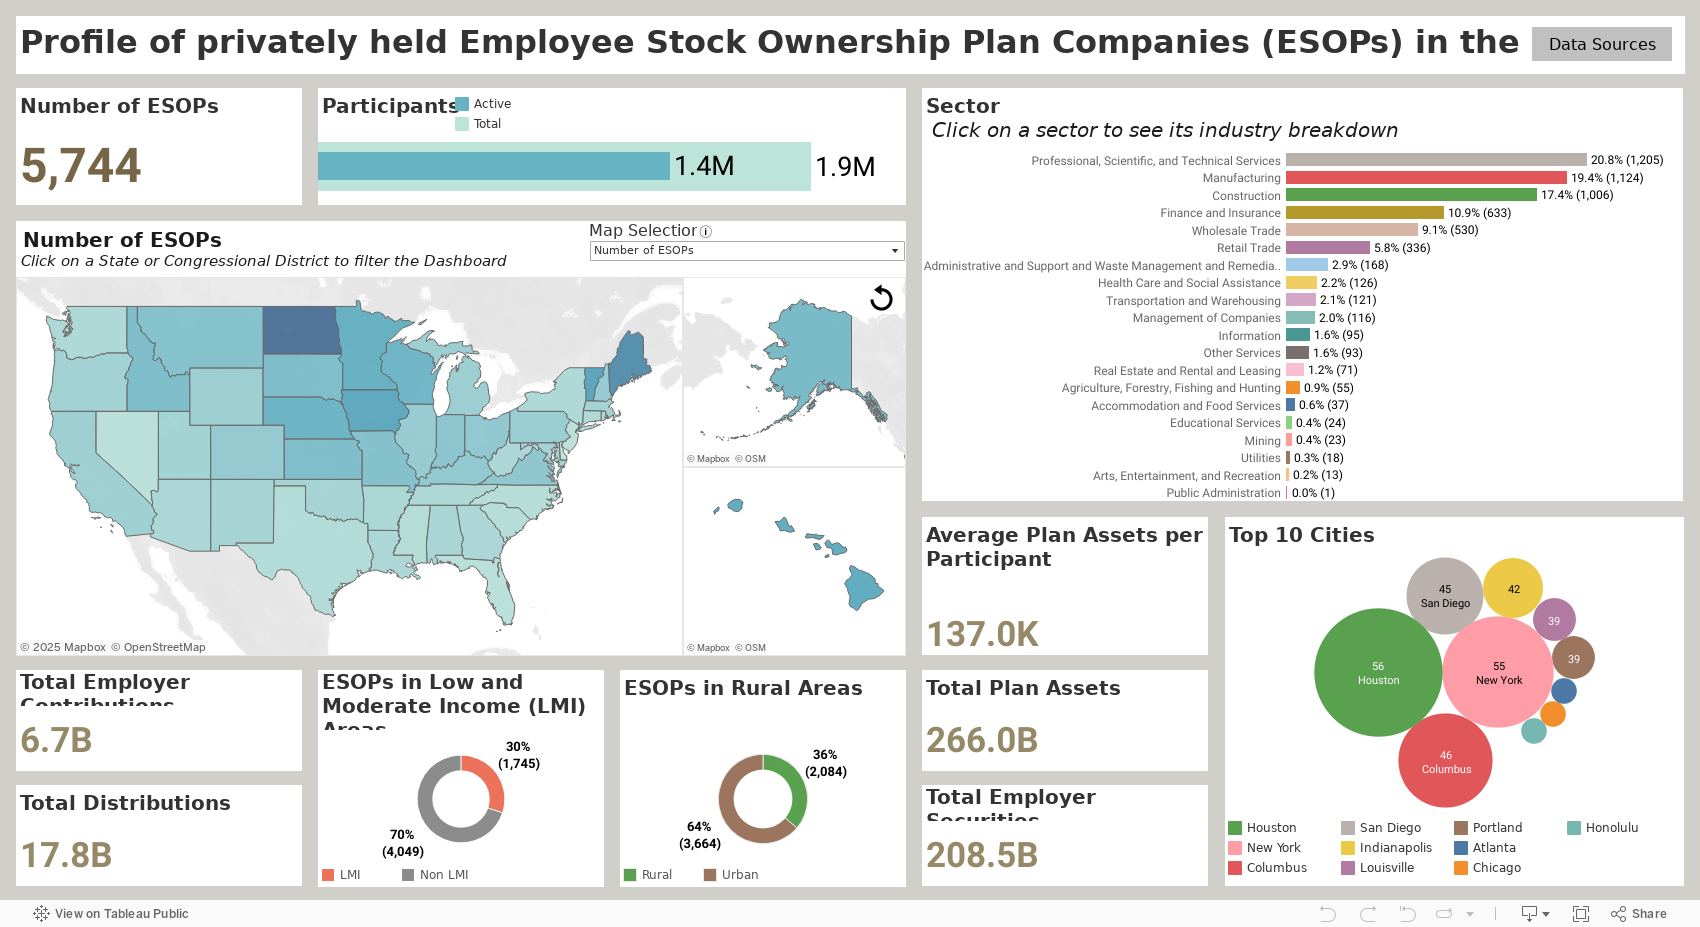
Employee Stock Ownership Plans were created by the Employee Retirement Income Security Act of 1974 as a federally recognized structure for broad-based ownership. Roughly 3 million U.S. workers are owners in approximately 6,000 privately-held ESOP firms today, and the research on outcomes is unusually consistent: ESOP employees accumulate retirement wealth at roughly 2.5 times the rate of workers at comparable non-ESOP firms, and ESOP companies exhibit materially lower turnover, higher productivity, and greater resilience through downturns.1
The opening in front of the ESOP model is demographic. More than half of privately-held U.S. businesses are owned by someone aged 55 or older, and the next ten years are expected to move an unprecedented volume of closely-held firms through succession. The default buyer is a private equity sponsor or a strategic acquirer. In both cases, the typical outcome for employees is a change in control followed by a change in headcount. A sale to an ESOP keeps the business intact, preserves the workforce, and moves equity onto the balance sheet of the people who built the company.2
What has slowed that outcome is financing. ESOP transactions are structurally more complex than a standard buyout, and the senior-debt capacity needed to close a mid-market ESOP has not kept pace with the succession wave. The bipartisan Employee Equity Investment Act, introduced in the Senate by Senators Chris Van Hollen and Marco Rubio and in the House by Representatives Blake Moore and Dean Phillips, would create a dedicated SBIC-style license for funds that finance employee-ownership transitions.3 The legislation is explicitly modeled on the same structure the Small Business Investment Company program has used to channel private capital into small-business equity since 1958.
This dashboard maps the current privately-held ESOP universe by state, metro area, NAICS sector, and firm size. The concentration in manufacturing, construction, and engineering services is the most visible pattern, and it tracks the industries where succession pressure is most acute and where working-class employment is most concentrated. For an HFA, a state economic development office, a union pension fund, or a direct lender, the dashboard is a starting point for identifying the geographies and industries where an ESOP conversion pipeline is most likely to close.
Sources
- National Center for Employee Ownership, Employee Ownership by the Numbers (2024); Rutgers Institute for the Study of Employee Ownership and Profit Sharing.
- Project Equity, The Silver Tsunami: Why the Wealth Transfer Puts Our Communities at Risk; U.S. Census Bureau Annual Business Survey, owner demographics file.
- S. 3591 / H.R. 6874, Employee Equity Investment Act, 118th Congress; U.S. Small Business Administration, SBIC Program Overview.